Page summary
This page presents statistics for the 2007 annual data drawn from AEI's student enrolment database. Selected time-series statistics are also presented.
AEI’s international student data for 2007 show there were 455 185 enrolments by full-fee international students in Australia on a student visa. This represents a growth of 19.0 per cent over the previous year. Commencements grew by 25.9 per cent in the same period.
Nationality
Enrolments
Asia remains Australia’s main source of international students, representing more than four out of every five of Australia’s overseas student market. The region was the main source of Australia’s international student market with strong growth recorded from the top four source nationalities. Growth in enrolments was mostly from India (63.9 per cent between 2006 and 2007), China (18.9 per cent), Thailand (11.9 per cent) and the Republic of Korea (11.3 per cent). Within the top 10 markets, Brazil also grew strongly (up 23.4 per cent) in 2007, displacing the United States as the ninth largest source nationality.
International student enrolments by top 10 nationalities, 2007
|
China |
107 071 |
23.5% |
18.9% |
|
India |
63 604 |
14.0% |
63.9% |
|
Republic of Korea |
34 674 |
7.6% |
11.3% |
|
Thailand |
19 987 |
4.4% |
11.9% |
|
Malaysia |
19 874 |
4.4% |
4.0% |
|
Hong Kong |
19 742 |
4.3% |
-3.3% |
|
Japan |
16 077 |
3.5% |
-9.5% |
|
Indonesia |
14 919 |
3.3% |
-0.5% |
|
Brazil |
12 545 |
2.8% |
23.4% |
|
United States of America |
11 822 |
2.6% |
-1.8% |
|
Other |
134 870 |
29.6% |
22.5% |
Overall, the growth outside the top 10 markets for 2007 has been stronger than the growth of the top 10 markets combined (22.5 per cent compared to 17.6 per cent). Nepal sustained its particularly strong growth through the year with an increase of 241.2 per cent (or an increase of 6525 enrolments over 2006). Other regions and markets with good growth include North Africa and the Middle East (42.7 per cent), Vietnam (44.1 per cent), Sri Lanka (34.7 per cent) and Brazil (23.4 per cent). Some major markets recorded falls in enrolments and they include Hong Kong, Japan, the USA, Taiwan and Singapore.
Commencements
There was a 25.9 per cent increase in the number of commencements between 2006 and 2007. The three largest source markets—China, India and the Republic of Korea—all showed growth over the previous year (27.9 per cent, 87.8 per cent and 8.6 per cent respectively). In addition, Thailand, Brazil and Malaysia also recorded good commencements growth (14.1 per cent, 19.5 per cent and respectively 10.6 per cent). Commencements from Japan, USA and Hong Kong declined over the year.
The strong growth in commencements from Nepal during the year has seen this market rise to the top 10. Commencements growth in 2007 was 282.9 per cent and represents 5420 more commencements than in 2006.
International student commencements by top 10 nationalities, 2007
|
China |
59 048 |
22.3% |
27.9% |
|
India |
39 404 |
14.9% |
87.8% |
|
Republic of Korea |
20 563 |
7.8% |
8.6% |
|
Thailand |
11 948 |
4.5% |
14.1% |
|
United States of America |
9741 |
3.7% |
-2.4% |
|
Japan |
9412 |
3.6% |
-10.1% |
|
Brazil |
9198 |
3.5% |
19.5% |
|
Hong Kong |
8920 |
3.4% |
-1.1% |
|
Malaysia |
8642 |
3.3% |
10.6% |
|
Nepal |
7336 |
2.8% |
282.9% |
|
Other |
80 197 |
30.3% |
20.5% |
Outside the top 10 markets, Vietnam, Colombia, Sri Lanka, Pakistan and Saudi Arabia all showed better growth than the top 10 nationalities combined, albeit from smaller bases. Although just outside the top 10, commencements from Indonesia grew 6.5 per cent and recorded positive growth for the second half of 2007. Most of this growth was in the Vocational Education and Training (VET) and English Language Intensive Courses for Overseas Students (ELICOS) sectors. If the commencements growth is sustained next year, further growth in the market from Indonesia will occur.
Sectors
Higher education
In 2007 the Higher education sector accounted for 39.1 per cent of all international student enrolments. The sector’s share of the international student market has slowly experienced a decline in the last three years, although the number of enrolments has continued to increase in absolute terms. The strong growth experienced by the VET and, to a lesser extent, the ELICOS sectors has led to this decline. This trend is likely to continue if the growth in the VET and ELICOS sectors continues at its current rate.
Higher education enrolments and commencements in 2007 increased by 3.8 per cent and 6.6 per cent respectively, on the same period in 2006. Strong growth in commencements was from India, Malaysia, and the Republic of Korea (10.8 per cent, 9.5 per cent and 14.4 per cent respectively). Nepal was the 10th largest market for commencements in the sector. With commencements growth of 140.7 per cent, Nepal had the second highest absolute growth in the sector after India. Other growth markets were Sri Lanka and Vietnam (27.2 per cent and 19.9 per cent respectively), with both just outside the top ten nationalities.
In 2007 the fields of study with the highest growth in the number of commencements in the Higher Education sector were Business Administration and Management and Nursing (with 1693 and 683 more commencements respectively on the same period in 2006). In contrast, the field of study with the largest proportion of commencements was Business Administration and Management (43.6 per cent). This was followed by Computer Science and Information Systems and Engineering and Surveying (10.2 per cent and 7.4 per cent respectively).
VET
The growth in the VET sector continued in 2007, with enrolments increasing by 45.6 per cent and commencements by 50.6 per cent over the previous year. India recorded the largest increase in the number of commencements in the sector, followed by Nepal and China. In 2007 India had 11 414 more commencements than in 2006, followed by Nepal and China with 3654 and 2562 more commencements respectively.
Most commencements in the VET sector were in the fields of Services, Hospitality and Transport and Business Administration and Management (40.9 per cent and 29.9 per cent respectively). Students from the top three source nationalities (India, China and the Republic of Korea) accounted for almost half (47.7 per cent) of all enrolments in these fields.
International student enrolments and commencements by sector, 2007
|
Sector |
Number |
% of total |
Growth on 2006 |
Number |
% of total |
Growth on 2006 |
|
Higher education |
177 760 |
39.1% |
3.8% |
72 603 |
27.5% |
6.6% |
|
VET |
121 422 |
26.7% |
45.6% |
74 575 |
28.2% |
50.5% |
|
ELICOS |
101 824 |
22.4% |
30.7% |
80 662 |
30.5% |
34.7% |
|
Schools |
27 426 |
6.0% |
11.5% |
14 092 |
5.3% |
25.2% |
|
Other |
26 753 |
5.9% |
5.6% |
22 477 |
8.5% |
5.8% |
ELICOS
The ELICOS sector showed strong enrolments and commencements growth in 2007 (30.7 per cent and 34.7 per cent respectively). Almost two thirds of the growth in commencements can be attributable to China and India, the largest and third largest ELICOS markets. Colombia, Brazil, Vietnam and Saudi Arabia also showed good growth in commencements, although the latter two were from smaller bases. Enrolments and commencements from Japan, Taiwan and Hong Kong have declined.
Schools
The Schools sector experienced good growth between 2006 and 2007 (11.5 per cent and 25.2 per cent in enrolments and commencements respectively). Enrolments in the sector grew in 2007 after a lengthy period of decline from 2003 to 2006. The growth in the sector was largely driven by China and the Republic of Korea. Vietnam and Germany also showed good growth, albeit from smaller bases.
Return to top
2007 annual pivot table
|
2007 basic annual
pivot table
(zip 558kb) |
Includes the variables Sector, Nationality, State and Territory and Region for year-to-date enrolments and commencements for the years 2002 to 2007.
Warning - Unzipped file is approximately 366 440kb. AEI advises that the pivot table is compatible with Excel 2003 or later. |
2007 annual tables
Detailed tables are available individually below, or as a complete set (pdf 98kb).
Table A: International student enrolments in Australia from top 10 source countries, 2002-2007 (pdf 32kb)
Table B: Time series of international student enrolments in Australia by country, 2002-2007 (pdf 33kb)
Table C: Time series of international student enrolments in Australia by state/territory, 2002-2007 (pdf 27kb)
Table D: International student enrolments in Australia by country and state/territory, 2005-2007 (pdf 31kb)
Table E: Time series of international student enrolments in Australia by major sector, 2002-2007 (pdf 26kb)
Table F: International student enrolments in Australia by country and major sector, 2005-2007 (pdf 34kb)
Table G: International student enrolments in Australia by state/territory and major sector, 2002-2007 (pdf 19kb)
The pivot table used to produce Tables A to G is included above. It contains the variables Sector, Nationality and Year, and refers to enrolments and commencements year-to-date December data.
Return to top
2007 state summaries
Return to top
2007 detailed monthly data
Please see detailed monthly tables of international student data.
Return to top
International student enrolments in Australia, 1994–2007
Introduction
International student enrolment annual statistics for 1994–2007 are summarised in the chart below. It shows sector level data for 1994–2007 and combines data from AEI's Overseas Student Statistics series and the Commonwealth Provider Register and International Student Management System (PRISMS). This chart should be used for indicative purposes only. Data for the periods 1994–2001 and 2002–07 are not comparable due to the different sources used to compile the data.
International student enrolments in Australia, 1994–2007
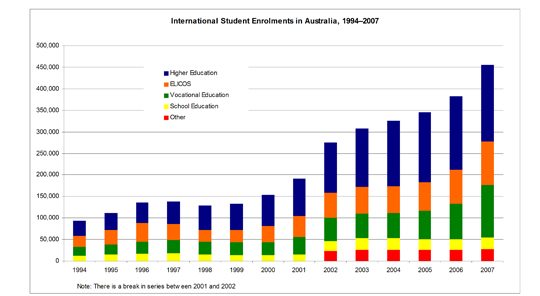
Note: there have been significant changes in methodology between 2001 and 2002.
1994–2001: Data were sourced from the DEST Higher Education Statistical Collection, CRICOS, the then Department of Immigration and Multicultural Affairs and AusAID.
From 2002: Onshore student data are derived from the Commonwealth Provider Registration and International Student Management System (PRISMS). The data show enrolments across all sectors for all students holding a student visa. These do not cover students on other visas, which in the case of ELICOS, involves a large number of students on tourist visas and, to a lesser extent, working holiday visas. As a general 'rule of thumb', for each ELICOS student on a student visa there is another on a non-student visa. For further information, please see Explanatory notes for AEI international student data.
The data do not cover offshore activity where Australian providers supply education services to foreign students overseas or by distance education where the student remains offshore. Data on offshore activity by Australian higher education institutions are available from the Higher Education Statistical Collection. Data on the Delivery of VET Offshore by Public Providers are available to MIP subscribers.
Return to top